1. Introduction: Why the Bowtie Method Matters in 2026
In 2026, risk doesn't just constrain strategy -- it drives it. Geopolitical instability, regulatory upheaval, and supply chain fragmentation mean that strategic decisions about markets, suppliers, and technology are increasingly risk-led rather than opportunity-led. For many organizations, maintaining the status quo has become the riskiest choice.
Traditional risk matrices can't keep up. Rating a risk as "high" tells you it's important, but it doesn't show you how an incident unfolds, which controls actually matter, or where your defenses have gaps. When your board asks "what would prevent this?" or regulators demand evidence that your controls are effective, a red box on a heat map doesn't answer the question.
This is where the bowtie method of risk assessment shines.
Rather than summarizing risk into a single score, the bowtie method visually maps how a risk event can occur, what could lead to it, what the consequences would be, and how controls operate before and after the event. The result is a clear, intuitive model that supports analysis, communication, and action -- not just documentation.
In this guide, we'll walk through the bowtie method step by step, explain when it's most effective, and show how it's commonly used in modern risk management practice.
2. What Is the Bowtie Method of Risk Assessment?
The bowtie method of risk assessment is a visual analysis tool designed to support a structured, scenario-based analysis of risk.
Rather than describing a risk in text or reducing it to a single score, the bowtie method uses a diagram to show -- in one intuitive view -- how a risk can develop, how it might unfold, and how an organization's mitigations or controls influence the outcome.
A bowtie diagram is scenario-based by design. It brings together multiple plausible paths to a single risk event and multiple potential consequences into one coherent picture. This allows different risk scenarios to be examined side by side, without losing the relationships between causes, the risk event, mitigations, and impacts.
It's often said that "a picture is worth a thousand words" and risk bowtie diagrams are a great example of this maxim. A well-constructed bowtie diagram makes complex risks easier to understand, explain, and challenge -- particularly for non-specialists and senior decision-makers who need clarity more than narrative detail.
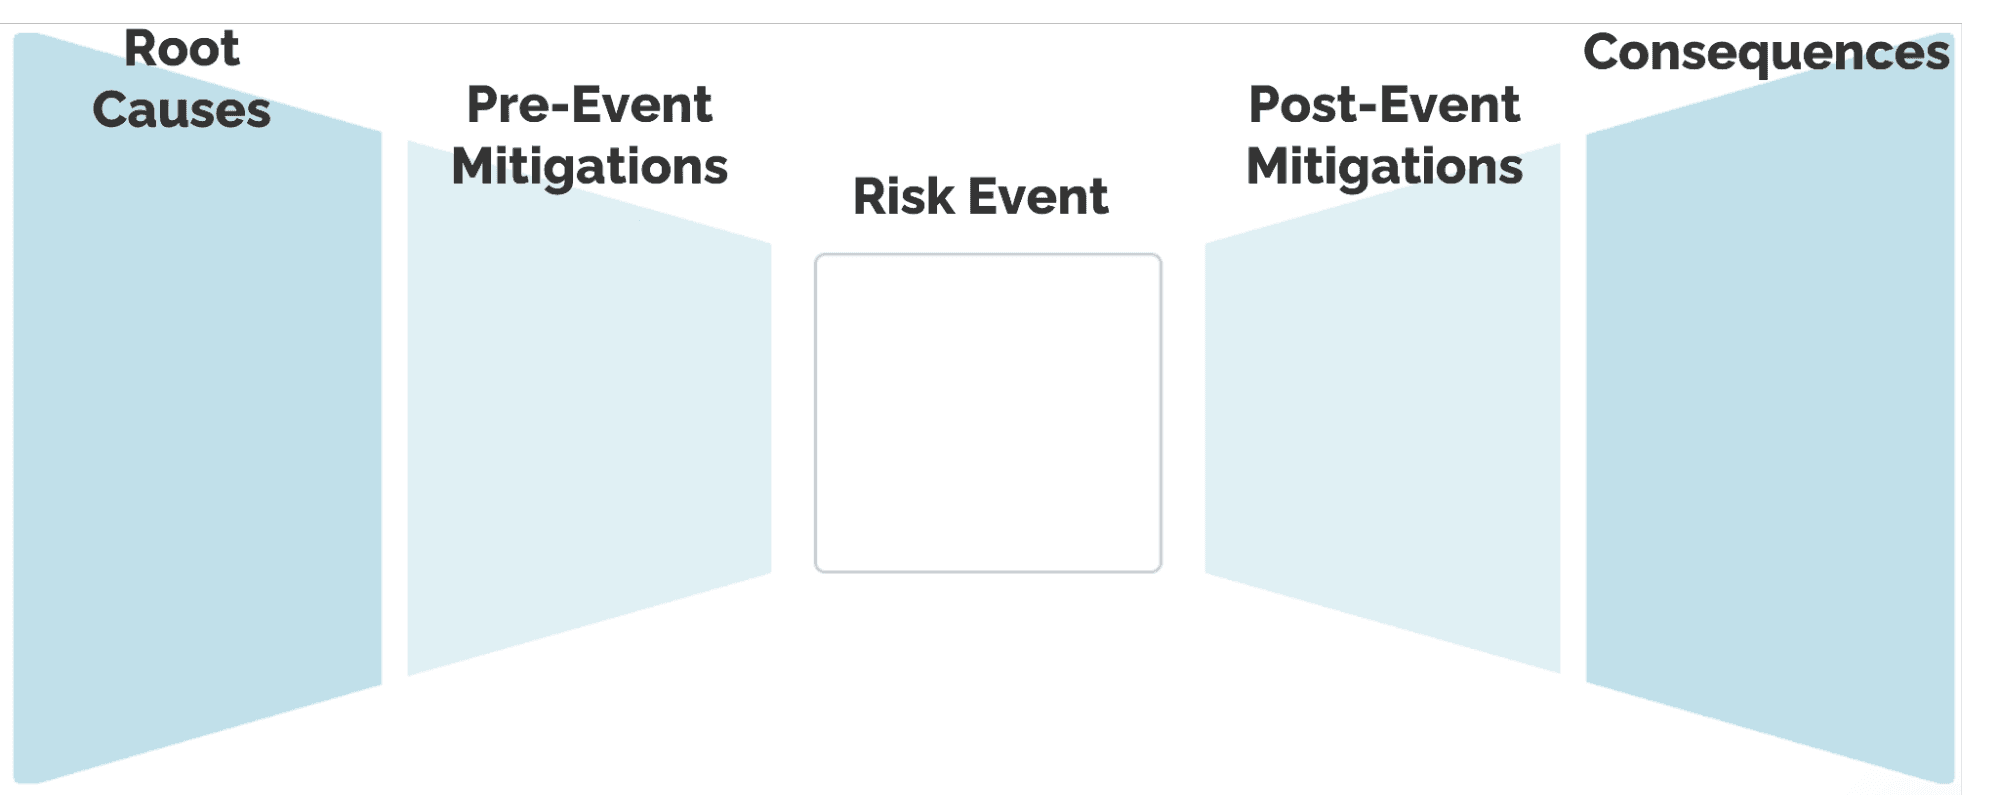
The structure of a bowtie diagram reflects the natural logic of how risk unfolds and flows from left to right:
- Threats or root causes on the left illustrate how the risk event could be triggered
- The risk event sits at the center as a clearly defined point of failure or loss of control
- Consequences on the right show what could happen if the event occurs
Mitigations (often referred to as controls in operational risk and compliance) are mapped along this path. Pre-event mitigations sit between root causes and the risk event and are typically designed to prevent the event occurring. Post-event mitigations come into play after the event has occurred and are focused on reducing the consequences (impact) of the event.
One of the bowtie method's greatest strengths is how clearly it exposes gaps and weaknesses in mitigations. By laying out each scenario visually, it becomes easier to see where mitigations are missing, duplicated, overly relied upon, or vulnerable to failure. This makes control effectiveness -- and the consequences of control failure -- far more visible than in traditional risk registers or matrices.
The example below illustrates this structure using a simple, non-business scenario: the risk of losing control of a car at high speed.
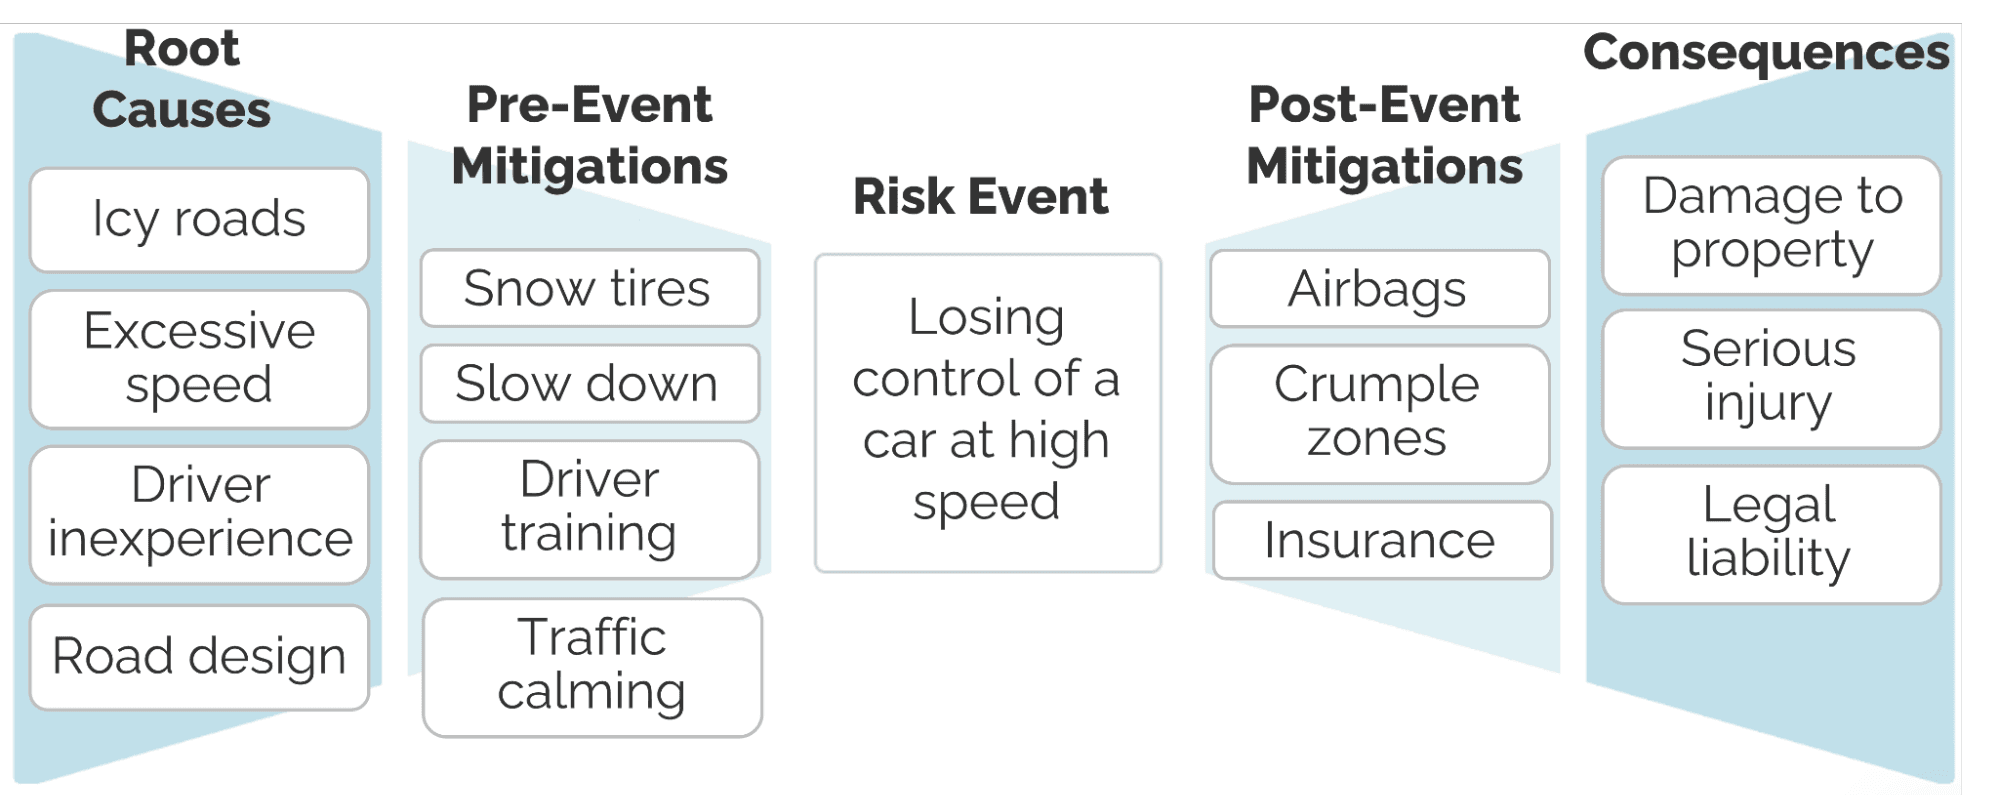
In this diagram, different root causes (such as road conditions or driver behavior) can lead to the same risk event, while multiple consequences may follow if the event occurs. Pre-event mitigations typically stem from the root causes and focus on preventing loss of control, while post-event mitigations are aimed at reducing harm once control is lost. Seeing these elements together makes it easier to understand how the risk unfolds -- and where additional mitigations might lessen the likelihood and impact of the event.
We'll return to this structure in Section 5 with a more detailed enterprise risk example.
By visually connecting causes, scenarios, mitigations, and outcomes in a single structured model, the bowtie method helps teams move beyond risk identification toward deeper understanding and more effective risk management.
Originally developed in safety-critical industries such as oil and gas and aviation, the bowtie method is now widely used across enterprise risk management, IT risk, cybersecurity, and compliance -- particularly where organizations need a clearer, more defensible view of how risks are controlled in practice.
3. When Should You Use the Bowtie Method (and When You Shouldn't)
The bowtie method is a powerful risk analysis tool -- but it delivers the most value when it is used selectively and with purpose.
Attempting to build detailed bowties for every risk can quickly become time-consuming, overwhelming, and counterproductive. In practice, bowtie analysis works best when it is used to answer a specific business or strategic question, not as a blanket requirement.
Using Bowties for Strategic Risk
Bowties are often associated with operational or safety risks, but they can be equally effective for enterprise and strategic risks when applied correctly.
Strategic risks tend to be discussed at a high level, yet their impact is realized through concrete risk events and scenarios. Bowtie analysis helps bridge that gap by showing how strategic uncertainty translates into operational failure and business impact.
Examples include strategic reliance on a small number of suppliers (examined through disruption or sanctions scenarios), market expansion strategies explored through regulatory, compliance, or execution failures, and technology and digital strategies stress-tested against cyber, resilience, and third-party risks.
In these cases, the bowtie does not replace strategic discussion -- it grounds it.
Avoiding the "Every Risk Needs a Bowtie" Trap
A common pitfall is assuming that every identified risk requires the same depth of analysis. In mature ERM programs, organizations typically perform an initial risk identification and assessment across the enterprise, prioritize risks based on inherent or residual risk and strategic importance, and apply bowtie analysis only to the highest-risk exposures, risks with significant cascading potential, or risks most critical to strategic objectives.
Used this way, bowties provide depth where it matters most, without overwhelming the program.
Keeping Bowtie Analysis Practical
Some methodologies insist on highly detailed bowties, including explicit line-by-line mappings between root causes, mitigations, and controls.
While this can add analytical rigor in certain contexts, it often increases complexity without improving insight -- and can reduce stakeholder engagement.
Effective bowtie analysis prioritizes clarity over completeness, insight over exhaustive modeling, and engagement over theoretical purity.
A good bowtie should make risk easier to understand and discuss, not harder.
Bowties as Part of an ERM Toolkit
Bowtie analysis complements -- rather than replaces -- traditional ERM tools. Risk registers and heat maps remain useful for portfolio-level prioritization. Bowties add depth by showing how risks unfold, where mitigations may fail, and where management attention is best focused.
Used this way, the bowtie method supports ERM's core objective: helping organizations protect strategic outcomes and make better-informed decisions in a changing environment.
4. Anatomy of a Bowtie Diagram
Before building a bowtie diagram, it's useful to understand the core components and the role each one plays in the analysis. While bowties can vary in complexity, effective diagrams share the same underlying structure and logic.
At its core, a bowtie diagram organizes a risk scenario into a cause-event-consequence model, with mitigations positioned to show how risk is prevented or reduced.
A. The Risk Event
The risk event sits at the center of the bowtie and represents a specific loss of control or failure that the organization is trying to prevent.
Note on risk events: In enterprise risk management, a risk event is an uncertain event that can affect the achievement of objectives. While impacts are often negative, uncertainty can also create positive outcomes or opportunities. Some teams extend bowtie analysis to model upside scenarios, but that can blur the distinction between risk analysis and opportunity management. In this guide, the bowtie method focuses on downside scenarios to keep the model clear and defensible.
A well-defined risk event is clear and unambiguous, specific enough to be testable, and neutral in tone (not already framed as an outcome).
Examples of good risk events include "Loss of customer data due to unauthorized access," "Extended outage of a critical production system," and "Failure to meet regulatory reporting deadlines."
Vague events (for example, "cyber risk" or "regulatory failure") make effective bowtie analysis difficult and should be avoided.
B. Root Causes (Threats or Triggering Conditions)
Root causes appear on the left side of the bowtie and describe how the risk event could be triggered.
These typically include process failures, human error, system or technology failures, and external events or third-party issues.
The goal is not to list every conceivable cause, but to capture the credible and material pathways that could lead to the event.
C. Consequences (Impacts)
Consequences appear on the right side of the bowtie and describe what could happen if the risk event occurs.
Consequences may include operational disruption, financial loss, regulatory or legal impact, physical harm, reputational damage, and/or strategic setbacks.
At this stage, it is usually sufficient to describe consequences qualitatively. Quantification and scoring can be layered in later if required.
D. Mitigations and Controls
Mitigations -- often referred to as controls, particularly in operational risk and compliance contexts -- are positioned between root causes, the risk event, and consequences.
They fall into two broad categories: pre-event mitigations, designed to prevent the risk event from occurring, and post-event mitigations, designed to reduce the severity or impact if the event does occur.
Mitigations should be specific and observable, linked to how risk is actually managed in practice, and distinguishable from aspirational statements or policies.
E. Control Effectiveness and Gaps
One of the strengths of bowtie analysis is how clearly it highlights control effectiveness and gaps.
As mitigations are added, practitioners can begin to assess where controls are missing, where multiple scenarios rely on the same mitigation, and where controls may be weak, outdated, or overly manual.
This analysis is often more valuable than the diagram itself.
In the next section, we'll walk through how to build a bowtie diagram step by step, using a practical enterprise risk example. The focus will be on applying these elements in a way that supports insight, engagement, and better risk decisions -- not creating unnecessary complexity.
5. Step-by-Step: How to Build a Bowtie Risk Diagram
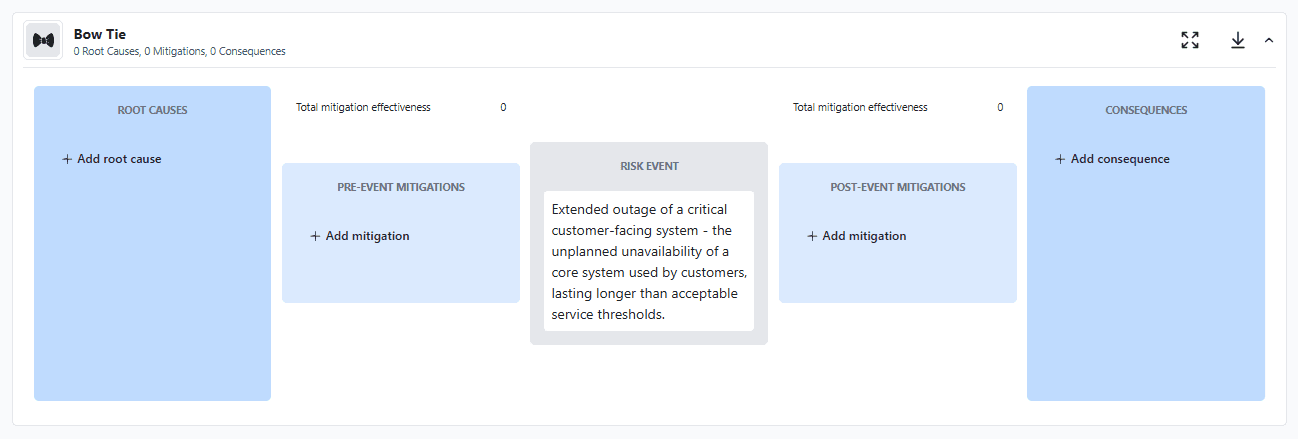
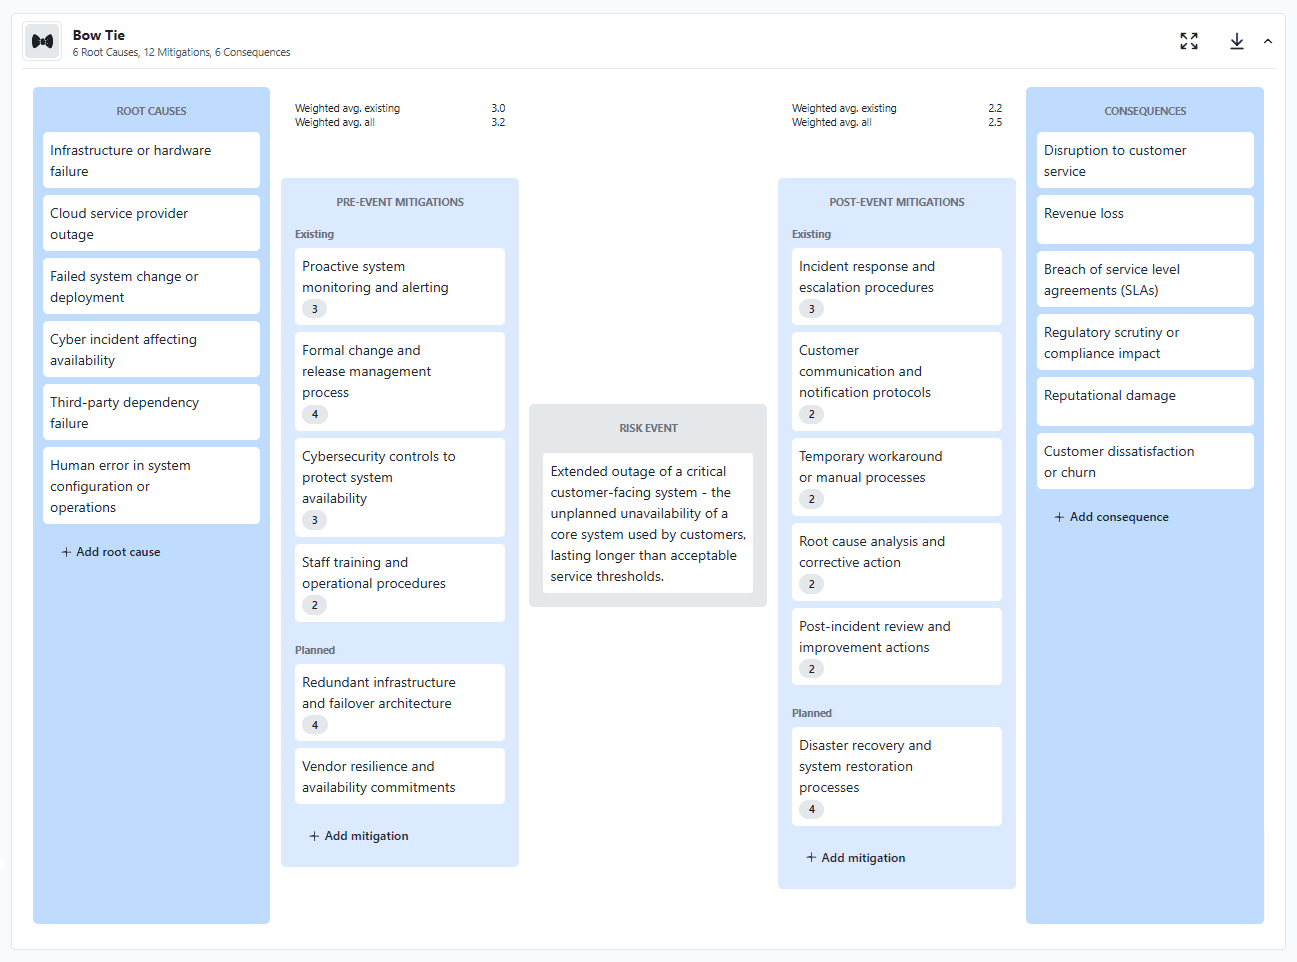
In this section, we'll walk through how to build a bowtie risk diagram using a practical enterprise example: an extended outage of a critical customer-facing system.
The screenshots shown in this section are taken from our Essential ERM system and are included purely for illustrative purposes, to show how the bowtie method can be applied in practice. The approach and logic are platform-agnostic and apply regardless of the tools used.
While the example is technology-related, the same steps apply to many strategic, operational, and compliance risks. The emphasis is on building a bowtie that supports insight, engagement, and better decisions -- not unnecessary complexity.
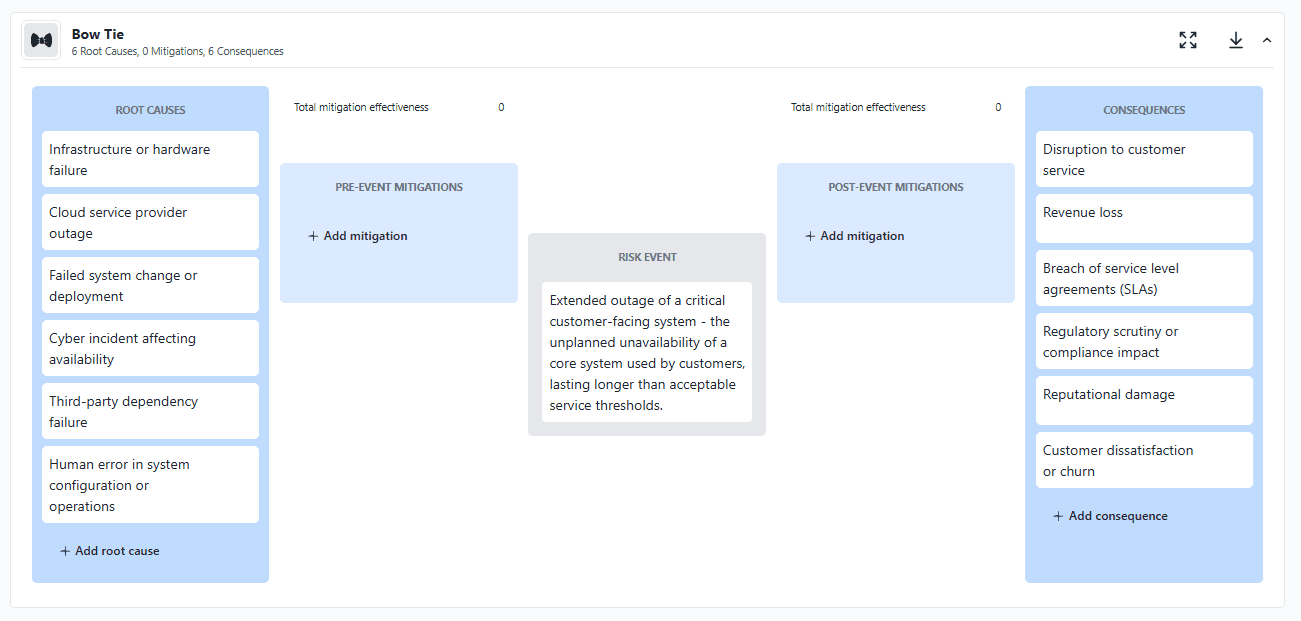
Step 1: Define a Clear, Testable Risk Event
Every effective bowtie starts with a clearly defined risk event.
The risk event should describe a specific loss of control or failure, not a root cause and not a consequence. It should be precise enough that reasonable people can agree when it has occurred.
For this example, the risk event is:
Extended outage of a critical customer-facing system
This is preferable to vague labels such as "system failure" or "IT risk," which are too broad to analyze meaningfully.
A useful test is to ask:
- Could this event be objectively identified if it occurred?
- Is the description neutral, without assuming impact or blame?
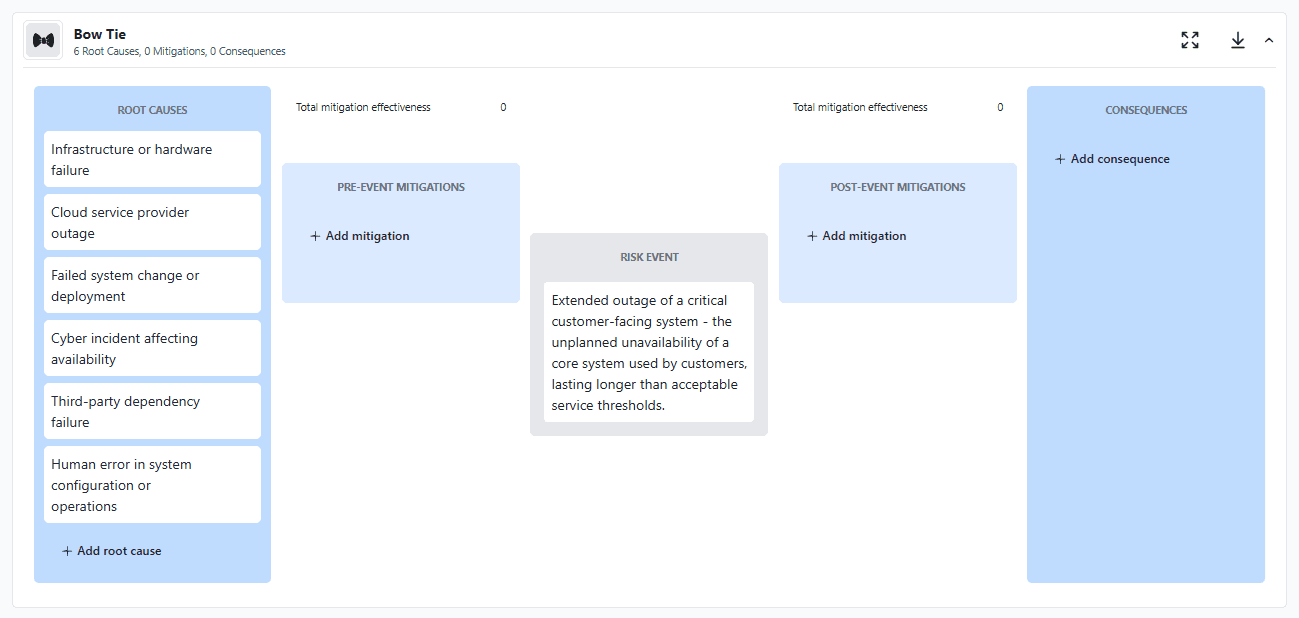
Step 2: Identify Credible Root Causes (Left Side)
Once the risk event is defined, the next step is to identify credible root causes -- the ways in which the event could be triggered.
The goal here is not to be exhaustive. Focus on plausible, material causes that stakeholders recognize as realistic.
For this example, root causes might include infrastructure or hardware failure, cloud service provider outage, failed system change or deployment, cyber incident affecting availability, third-party dependency failure, and human error in system configuration or operations.
Each root cause represents a different scenario that could lead to the same risk event.
Step 3: Identify Realistic Consequences (Right Side)
Next, identify the consequences that could follow if the risk event occurs. Consequences describe what happens after control is lost, and should reflect outcomes that matter to the business.
In this example, consequences may include disruption to customer service, revenue loss, breach of service level agreements, regulatory or compliance impact, reputational damage, and customer dissatisfaction or churn.
At this stage, consequences can usually be described qualitatively. More detailed quantification can be layered in later if required.
One of the benefits of a bowtie diagram is how easily and intuitively it can convey multiple consequences at once. Risk managers can sometimes get hung up on trying to rigidly define reputational damage as a risk or risk category, when in reality, many different risk events can lead to reputational damage — along with other impacts simultaneously.
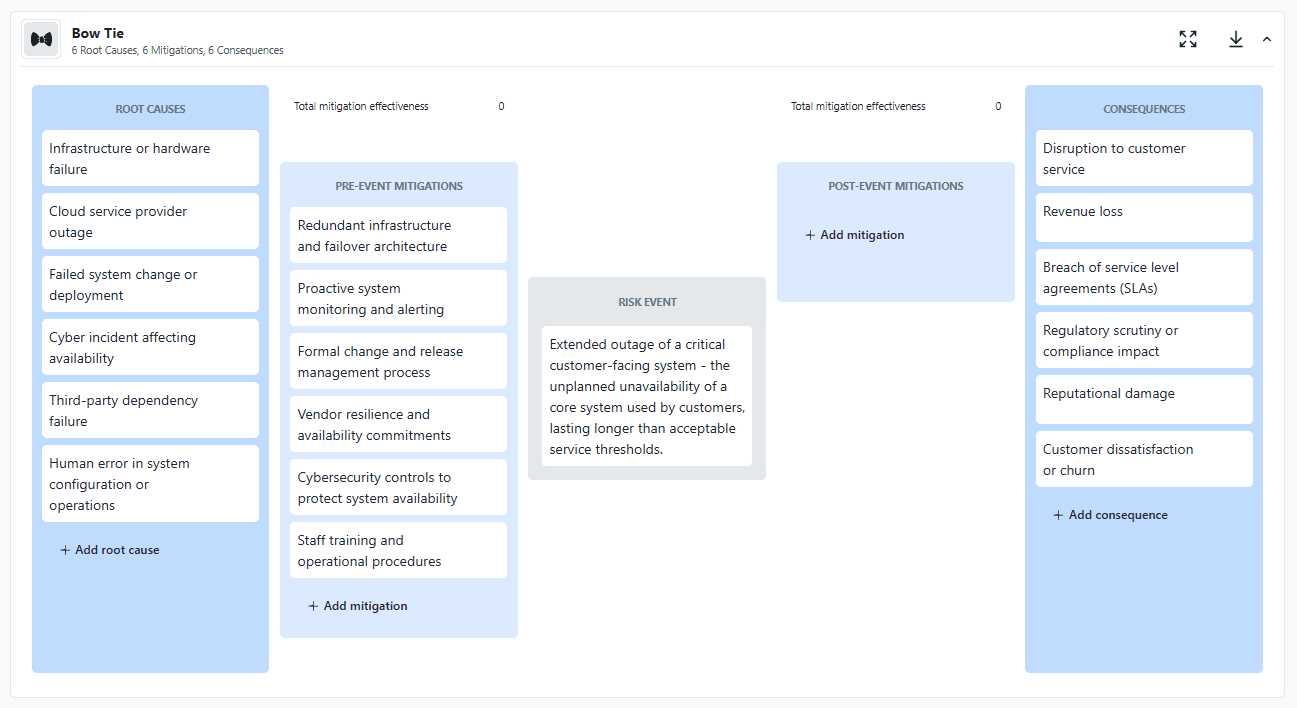
Step 4: Map Pre-Event and Post-Event Mitigations
With root causes and consequences identified, the bowtie takes shape by adding mitigations (often referred to as controls) along the pathway.
Mitigations generally fall into two categories: pre-event mitigations, designed to prevent the risk event from occurring, and post-event mitigations, designed to reduce the impact once the event has occurred.
For the system outage example, pre-event mitigations might include redundant infrastructure and failover design, proactive system monitoring and alerting, formal change and release management, vendor resilience requirements, and cybersecurity measures to protect availability.
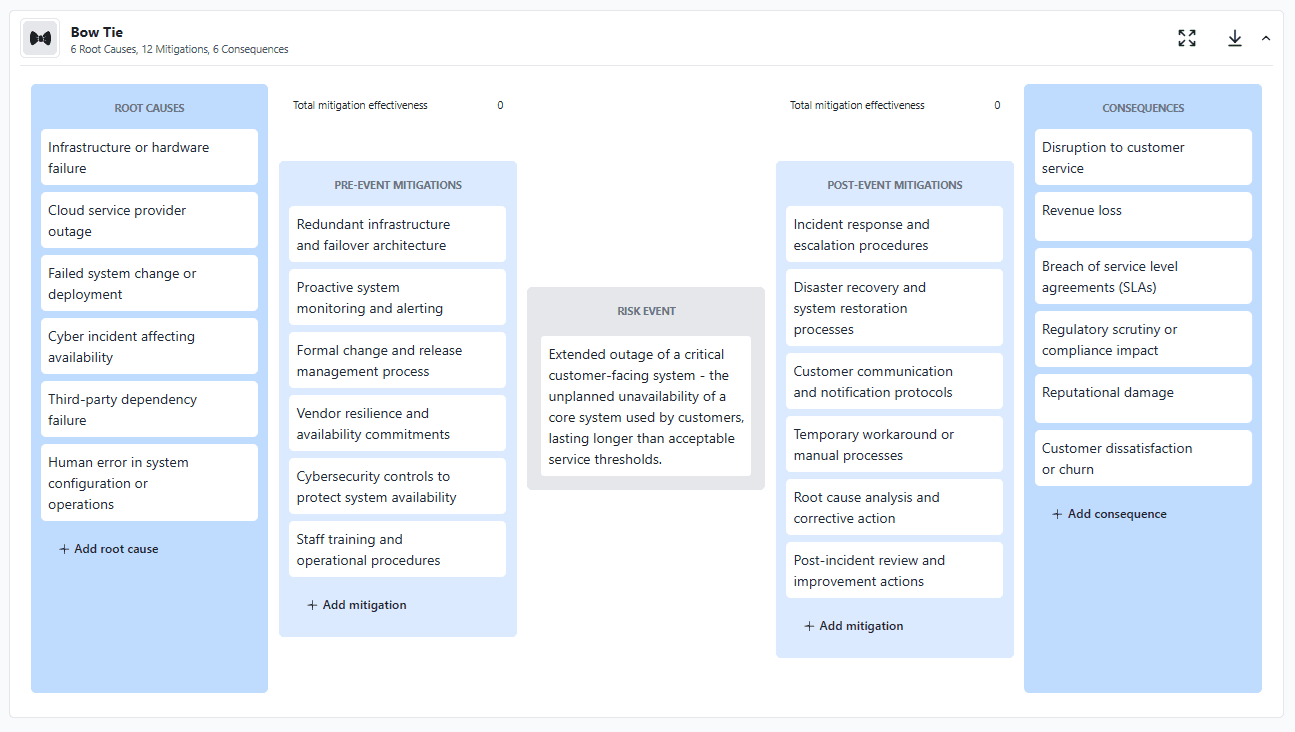
Post-event mitigations might include incident response and escalation procedures, disaster recovery and restoration processes, customer communication protocols, temporary workarounds, and post-incident review and corrective actions.
In practice, stakeholders will often identify both existing mitigations and planned mitigations during workshops. Rather than excluding planned mitigations, it is often more effective to capture them explicitly and distinguish them from controls that are already in place.
Planned mitigations do not improve control effectiveness yet -- but capturing them in the bowtie preserves stakeholder engagement, makes future risk treatment explicit, and creates a natural trigger to reassess control effectiveness once the mitigation is implemented.
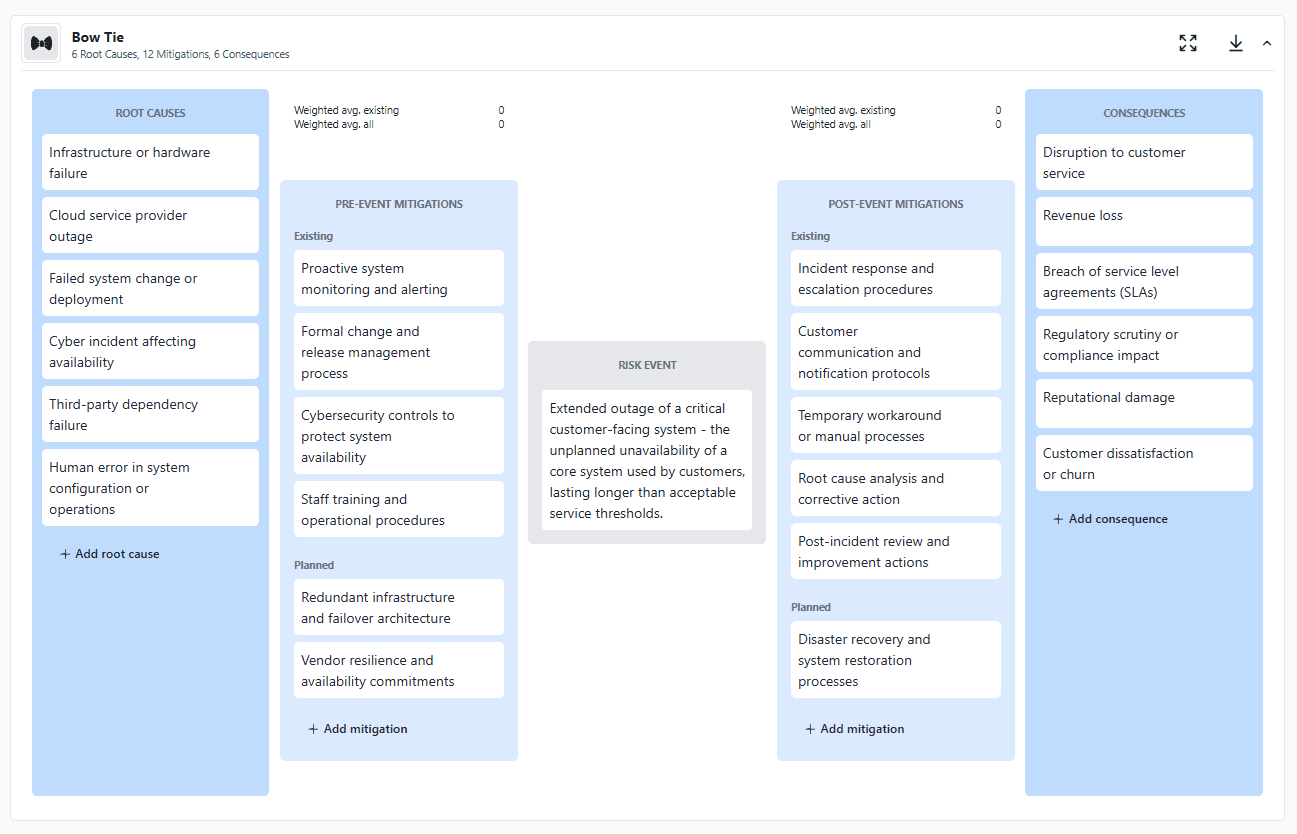
Step 5: Assess Mitigation Effectiveness
This is where bowtie analysis becomes especially powerful.
Simply listing mitigations is not enough. Bowties make it easier to assess how effective existing mitigations actually are, and where risk exposure remains.
This step often highlights mitigations that exist but are weak or outdated, controls that rely heavily on manual processes, scenarios that depend on the same mitigation (creating concentration risk), and areas where planned mitigations, once implemented, could materially reduce exposure.
Separating existing and planned mitigations helps keep this assessment grounded in reality, without discouraging forward-looking discussion.
In practice, many teams find it helpful to assess mitigation effectiveness in the context of the specific risk being analyzed, rather than treating controls as uniformly strong or weak across the enterprise. In Essential ERM, individual mitigations can be optionally scored for effectiveness (shown by the number badges on the mitigations in the image above) and weighted based on their relative importance, allowing the system to calculate an overall view of control effectiveness for the risk (shown in the numbers at the top of each mitigation column).
Existing and planned mitigations are treated separately, so teams can see both current effectiveness and how effectiveness is expected to improve once planned mitigations are implemented. This makes it possible to model today's exposure and tomorrow's risk posture at the same time, without overstating the impact of controls that are not yet in place.
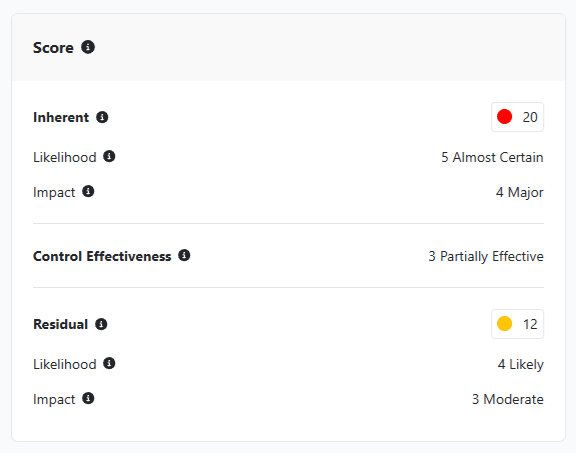
Step 6: Review Residual Risk and Identify Actions
Finally, review the bowtie as a whole and consider the residual risk after existing mitigations are taken into account.
Key questions include:
- Does the residual risk fall within the organization's risk appetite?
- Where are the most significant remaining exposures?
- Which planned mitigations, if implemented, would have the greatest impact?
- Are there additional Risk Treatment steps we need to take?
- Are there any mitigations that we no longer require? Are we over-mitigating this risk?
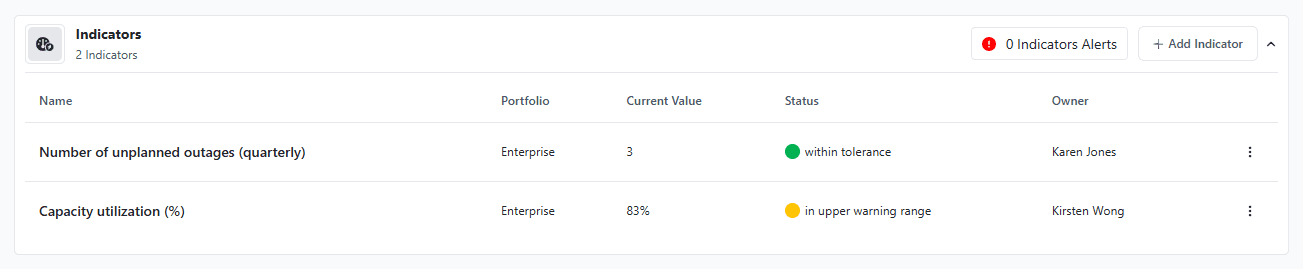
If the risk remains outside appetite, the bowtie helps identify focused, practical actions, rather than broad or unfocused responses. You may also identify key risk indicators to monitor, that provide an early warning on whether or not your control effectiveness is improving or declining.
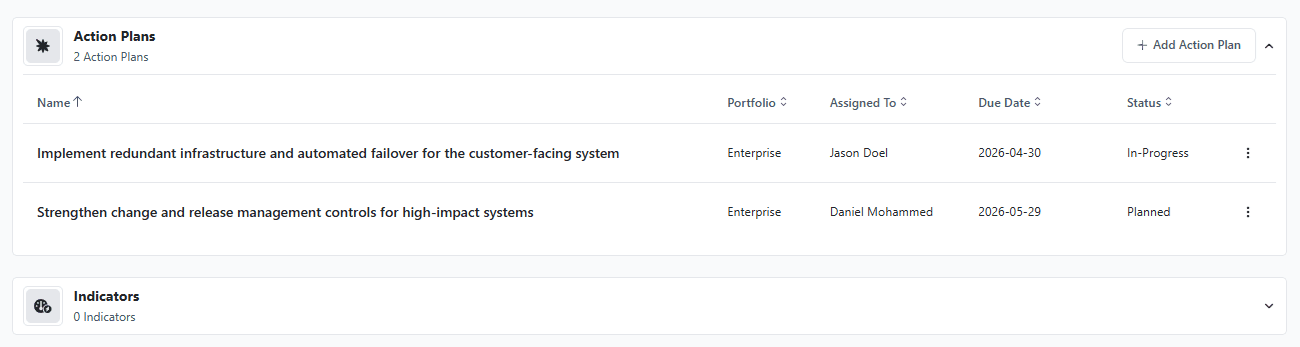
By the end of this process, the bowtie diagram provides a shared, scenario-based view of how the risk unfolds, where it is controlled today, and where additional effort -- tracked through indicators and action plans -- would meaningfully reduce exposure. The value lies not just in the diagram itself, but in the clarity and alignment it creates.
In the next section, we'll look at common mistakes organizations make when using the bowtie method -- and how to avoid them.
6. Six Common Mistakes When Using the Bowtie Method (and How to Avoid Them)
The bowtie method is widely regarded as intuitive and powerful -- yet many organizations struggle to realize its full value. In most cases, the issue isn't the method itself, but how it's applied.
Below are some of the most common pitfalls practitioners encounter, along with practical guidance on how to avoid them.
Mistake 1. Defining Vague or Overly Broad Risk Events
One of the most frequent mistakes is starting with a risk event that is too vague to analyze meaningfully.
Examples such as "cyber risk," "IT failure," or "regulatory non-compliance" lack the specificity needed to identify root causes, consequences, and effective mitigations.
How to avoid it:
Define the risk event as a specific loss of control that can be clearly identified if it occurs (for example, "extended outage of a critical customer-facing system"). Precision at the center of the bowtie drives clarity everywhere else.
Mistake 2. Treating Root Causes as a Laundry List
Another common issue is attempting to document every conceivable root cause, resulting in an overcrowded and unfocused diagram.
While completeness can feel reassuring, overly long lists often obscure the most important scenarios and reduce stakeholder engagement.
How to avoid it:
Focus on credible and material root causes -- those that represent realistic pathways to the event and warrant management attention. The goal is insight, not encyclopedic coverage.
Mistake 3. Copying Controls Directly from Policies or Frameworks
In some organizations, mitigations are copied verbatim from policies, standards, or control libraries without validating whether they actually operate as described.
This can create a false sense of control strength and undermine the usefulness of the bowtie.
How to avoid it:
Document mitigations as they are actually implemented and used, not as they appear in policy documents. Where effectiveness is uncertain, acknowledge it -- the bowtie is meant to surface these gaps, not hide them.
Mistake 4. Over-Engineering the Diagram
Some practitioners feel pressure to create highly detailed bowties, including explicit mappings between every root cause and every mitigation.
While this level of rigor can be useful in certain safety-critical contexts, it often adds complexity without improving decision-making in enterprise risk settings.
How to avoid it:
Prioritize clarity and usability over theoretical purity. A bowtie should support discussion and insight -- not become an exercise in diagram maintenance.
Mistake 5. Treating Bowties as Static Artifacts
A bowtie built once and never revisited quickly loses relevance, especially in dynamic risk environments.
Static bowties can give the impression that risks are "under control" even as conditions change.
How to avoid it:
Use bowties as living models. Update them when incidents occur, controls change, or new information emerges. Tie them to indicators, reviews, and action plans so they evolve alongside the risk.
Mistake 6. Applying Bowties to Every Risk Equally
Finally, some organizations attempt to apply bowtie analysis uniformly across all risks, regardless of materiality or strategic relevance.
This often leads to fatigue, resistance, and superficial analysis.
How to avoid it:
Use bowties selectively -- for risks with high exposure, significant cascading potential, or strong links to strategic objectives. When applied thoughtfully, bowties deepen understanding where it matters most.
When used well, the bowtie method strengthens risk conversations and decision-making. When misapplied, it can feel burdensome or academic. Learning from these common mistakes helps ensure bowtie analysis remains a practical, high-value part of an effective ERM program. In the next section, we'll compare the bowtie method with traditional risk assessment approaches, and explore how they can work together rather than in competition.
7. Bowtie Method vs Traditional Risk Assessments
Most organizations already use established risk assessment tools such as risk registers, risk matrices, and heat maps. These tools play an important role in enterprise risk management -- particularly for risk identification, prioritization, and portfolio-level reporting.
The bowtie method is not a replacement for these tools. Instead, it adds depth where traditional approaches often fall short.
Risk Registers
Risk registers are effective for documenting risks, assigning ownership, and tracking status over time. They provide a structured inventory of risk across the organization.
However, registers typically describe risks in summary form. While they capture what the risk is and how severe it might be, they often provide limited insight into how the risk actually unfolds, which scenarios are most concerning, or where controls may fail.
Bowtie analysis complements the risk register by unpacking priority risks into cause-event-consequence pathways, making control coverage and gaps far more visible.
Risk Matrices and Heat Maps
Risk matrices and heat maps are widely used to visualize relative risk exposure and support prioritization discussions.
Their limitation is not accuracy, but resolution. A single score or color can signal importance, but it does not explain why the risk is rated as it is, which controls are driving that rating, or what would meaningfully change the exposure.
Bowtie diagrams address this limitation by showing how likelihood and impact are influenced by specific mitigations -- and how those mitigations perform in different scenarios.
In practice, many organizations use heat maps to decide which risks deserve deeper analysis, and bowties to perform that analysis.
Scenario Thinking vs Risk Categorization
Traditional assessments often rely on categorizing risks (e.g., operational, strategic, reputational). While categorization is useful for reporting, it can obscure how risks actually behave.
Bowtie analysis is inherently scenario-based. It allows a single risk event to arise from multiple root causes and lead to multiple consequences simultaneously.
This makes it easier to see how operational failures can escalate into regulatory, reputational, or strategic impacts -- something that category-based models struggle to show.
Operational Usefulness
Perhaps the most important distinction is how the outputs are used.
Traditional risk tools are often optimized for reporting and oversight. Bowtie diagrams are optimized for analysis and action.
By explicitly mapping root causes, mitigations, effectiveness, and consequences, bowties support targeted risk treatment decisions, focused investment discussions, and clearer accountability for control performance.
For many practitioners, this operational usefulness is where bowtie analysis delivers its greatest value.
Working Together, Not in Competition
In effective ERM programs, these tools are not competing -- they are complementary.
A common pattern is risk registers and heat maps for breadth and prioritization, and bowtie analysis for depth on the most critical risks.
Used together, they provide both enterprise-wide visibility and scenario-level insight, strengthening risk management without adding unnecessary complexity.
In the next section, we'll explore how bowtie diagrams can be used as living risk models, evolving over time as controls, incidents, and business conditions change.
8. Using Bowtie Diagrams as Living Risk Models
One of the most common misconceptions about bowtie diagrams is that they are static artifacts -- created once, reviewed briefly, and then archived. Used that way, their value is limited.
In practice, bowtie diagrams are most effective when treated as living risk models that evolve as the organization, its controls, and its environment change.
From One-Time Analysis to Ongoing Insight
Unlike traditional risk assessments that are refreshed on a fixed cycle, bowties can be revisited whenever something material changes, such as a significant incident or near miss, the implementation of a planned mitigation, changes in third-party dependencies, shifts in strategy or operating context, or new regulatory or compliance expectations.
Because bowties explicitly show how risks unfold and where mitigations operate, even small changes can be evaluated in context -- without rebuilding the analysis from scratch.
Linking Bowties to Indicators and Monitoring
Bowties naturally support early-warning indicators.
Root causes, mitigations, and consequences often point directly to measurable signals -- such as system availability metrics, control testing results, vendor performance indicators, or incident trends. Monitoring these indicators alongside the bowtie helps teams understand not just whether risk is changing, but why.
When indicators deteriorate, the bowtie provides immediate context for which scenarios are becoming more likely, which mitigations may be weakening, and where management attention should be focused.
Supporting Change and Continuous Improvement
Bowtie diagrams are also well suited to managing change.
As planned mitigations are implemented, control effectiveness can be reassessed and residual risk recalibrated. This allows teams to demonstrate how risk exposure is expected to improve, track whether improvements are actually realized, and prioritize next steps if risk remains outside appetite.
Over time, this creates a clear line of sight between risk treatment decisions, control performance, and outcomes.
Improving Communication and Alignment
While this article is written for practitioners, one of the practical benefits of living bowties is how well they support communication with non-specialists.
Because the model is visual and scenario-based, it translates complex risk discussions into a format that executives, boards, and auditors can engage with quickly -- without oversimplifying the underlying analysis.
Used consistently, bowties become a shared reference point for discussing risk across functions and over time.
A Practical Shift in ERM Maturity
Treating bowtie diagrams as living models represents a broader shift in ERM maturity -- from periodic assessment toward continuous understanding and informed action.
Rather than asking "Have we assessed this risk?", teams can ask more meaningful questions:
- Are our controls still effective?
- Which scenarios are becoming more concerning?
- Where should we invest next to protect strategic outcomes?
In this way, bowtie analysis moves beyond documentation and becomes an integral part of how organizations manage risk in a changing environment.
9. Try It Yourself: Build a Bowtie Diagram
Understanding the theory and structure of a bowtie diagram is one thing -- applying it in practice is where the insights really take shape.
To help you bridge that gap, we've made an interactive bowtie builder available on our website. This tool lets you experiment with building your own bowtie diagrams, step by step, using the same concepts described in this guide.
Whether you're exploring how a risk could unfold, testing different root causes and mitigations, visualizing multiple consequence pathways, or modeling how planned actions will improve control effectiveness, the interactive builder provides a hands-on way to practice without needing to configure a risk in your core ERM system first.
Try it here: https://www.trackernetworks.com/resources/risk-bow-tie
Hands-on practice: The interactive bowtie builder is free to use and does not require an account. It is designed to help you test scenarios and see how mitigations change risk exposure in real time.
How to Use the Interactive Bowtie Builder
- Start by defining your risk event right at the center.
- Add credible root causes on the left and realistic consequences on the right.
- Add pre-event and post-event mitigations to see how they influence your scenario.
- Use the tool to explore different combinations and see how they change your understanding of the risk.
The tool is free to use and does not require an account -- it's meant to help you deepen your practical understanding of the bowtie method.
10. Key Takeaways
- The bowtie method is a scenario-based risk analysis tool, not just a visual. It helps teams understand how a risk unfolds, how it is controlled, and where exposure remains.
- Bowtie analysis complements traditional ERM tools such as risk registers, heat maps, and fishbone diagrams by adding depth and clarity to priority risks.
- Not every risk needs a bowtie. The method is most effective when applied selectively to high-impact risks, risks with cascading consequences, or risks closely tied to strategic objectives.
- Clear risk events matter. A well-defined, testable risk event at the center of the bowtie drives better root cause analysis, more meaningful mitigations, and clearer discussions.
- Separating existing and planned mitigations improves realism. Planned actions can be captured without overstating current control effectiveness, while still supporting forward-looking risk treatment.
- Assessing mitigation effectiveness is where insight emerges. Bowties make it easier to see control gaps, concentration risk, and where targeted improvements will have the greatest impact.
- Bowties work best as living risk models. When updated with indicators, incidents, and action progress, they support continuous risk understanding rather than periodic assessment.
- Used well, bowties strengthen decision-making. The real value lies not in the diagram itself, but in the shared understanding and alignment it creates across risk, operations, and leadership.
_BestMeetsRequirements_Mid-Market_MeetsRequirements.svg)
_BestSupport_Enterprise_QualityOfSupport.svg)
_BestSupport_Mid-Market_QualityOfSupport.svg)
_BestSupport_QualityOfSupport.svg)
_BestUsability_Mid-Market_Total.svg)
_EasiestAdmin_EaseOfAdmin.svg)
_EasiestAdmin_Enterprise_EaseOfAdmin.svg)
_EasiestAdmin_Mid-Market_EaseOfAdmin.svg)
_EasiestSetup_EaseOfSetup.svg)
_EasiestSetup_Mid-Market_EaseOfSetup.svg)
_EasiestToDoBusinessWith_EaseOfDoingBusinessWith.svg)
_EasiestToDoBusinessWith_Enterprise_EaseOfDoingBusinessWith.svg)
_EasiestToDoBusinessWith_Mid-Market_EaseOfDoingBusinessWith.svg)
_EasiestToUse_Enterprise_EaseOfUse.svg)
_EasiestToUse_Mid-Market_EaseOfUse.svg)
_FastestImplementation_Mid-Market_GoLiveTime.svg)
_HighPerformer_Enterprise_HighPerformer.svg)
_HighPerformer_HighPerformer.svg)
_HighPerformer_Mid-Market_HighPerformer.svg)
_HighestUserAdoption_Mid-Market_Adoption.svg)
_MostImplementable_Mid-Market_Total.svg)
_UsersMostLikelyToRecommend_Mid-Market_Nps.svg)